Difference: JqPlotPlugin ( vs. 1)
Revision 12013-03-06 - TWikiGuest
| Line: 1 to 1 | |||||||||||||||||||||||||||||||||||||
|---|---|---|---|---|---|---|---|---|---|---|---|---|---|---|---|---|---|---|---|---|---|---|---|---|---|---|---|---|---|---|---|---|---|---|---|---|---|
| Added: | |||||||||||||||||||||||||||||||||||||
| > > | JqPlotPlugin<-- Contributions to this plugin are appreciated. Please update the plugin page at http://twiki.org/cgi-bin/view/Plugins/JqPlotPlugin
Page contents
Usage
%JQPLOT{"canvasTextRenderer,canvasAxisLabelRenderer"}%
<div id='chart1' style='height:280px; width: 500px;'></div>
<script>
$.jqplot ('chart1', [[3,7,9,1,4,6,8,2,5]]);
</script>
<--
The following would look better if the real thing and the screenshot are
displayed side-by-side.
But on IE 7, a jqplot generated graph is not displayed in a table cell.
-->
Resulting chart (if plugin is installed and enabled): %JQPLOT{"canvasTextRenderer,canvasAxisLabelRenderer"}% Simulated (screenshot): 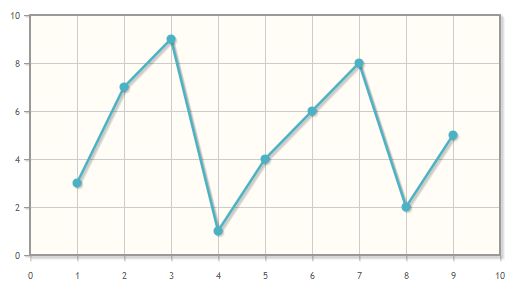 More examples are found in the official jqPlot website
DescriptionjqPlot%JQPLOT% tag.
Since jqPlot depends on the jQuery JavaScript library, JQueryPlugin must be installed for JqPlotPlugin to work.
When a %JQPLOT% tag is present, the necessary JavaScript and CSS references are added to the <head> of the page. The %JQPLOT% tag itself is expanded into an empty string. Even if the tag happens to be used multiple times, the required references are added only once.
In order to use jqPlot plugins (for bar charts, pie charts, axis labels, etc.), the plugin names should be added to the %JQPLOT% tag.
%JQPLOT{"barRenderer, pieRenderer, categoryAxisRenderer"}%
 or
%JQPLOT{"barRenderer"}%
%JQPLOT{"pieRenderer"}%
%JQPLOT{"categoryAxisRenderer"}%
The above will add the <script> tags to the <head> as below:
<script type="text/javascript" src=".../plugins/jqplot.barRenderer.min.js"></script>
<script type="text/javascript" src=".../plugins/jqplot.pieRenderer.min.js"></script>
<script type="text/javascript" src=".../plugins/jqplot.categoryAxisRenderer.min.js"></script>
All the common references such as jquery.jqplot.min.js (which would be added by the empty %JQPLOT%) are also added automatically.
Installation InstructionsNote: You do not need to install anything on the browser to use this plugin. The following instructions are for the administrator who installs the plugin on the TWiki server.
Plugin InfoMany thanks to the following sponsors for supporting this work:
| ||||||||||||||||||||||||||||||||||||
Ideas, requests, problems regarding TWiki? Send feedback
Note: Please contribute updates to this topic on TWiki.org at TWiki:TWiki.JqPlotPlugin.